Listening to the sun on a loop
A composer pricks his ears up for NASA and helps make a discovery
Virat Markandeya • March 7, 2012
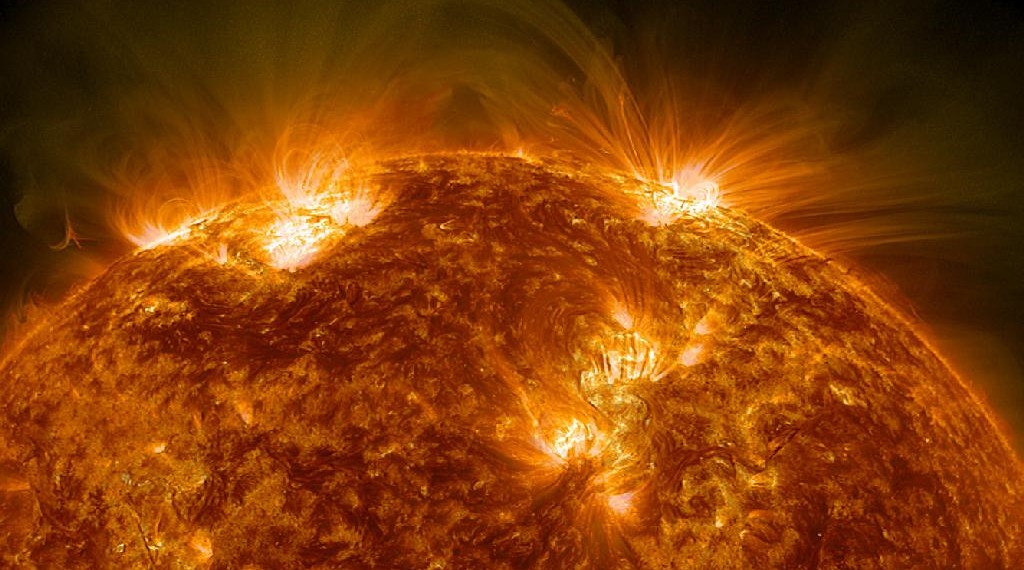
Researchers are analyzing solar data through sound. [Image credit: NASA]
Robert Alexander picked up “the hum” on a chilly January day in 2011. He was at a coffee shop near the University of Michigan, listening to data from the sun on a loop while sending emails. Alexander couldn’t know it then, but the hum, which even to his well-tutored ear just sounded like noise, would lead to a scientific paper and a NASA fellowship.
Alexander has a background in media arts but now works for a NASA research group that studies the eccentricities of our closest star. As a composer, he has created grand orchestral pieces from solar data. He is using some of that knowledge to explore data analysis through sound, trying to find patterns in numbers that typically yield unruly visual cues.
Out in space, a NASA satellite called the Advanced Composition Explorer measures changes in the sun’s magnetic field. Much in the way changes in magnetic intensity are used to store data in analogue tapes, Alexander turns the instrument on the satellite into his recording studio.
Alexander typically compresses 44,100 data points into a second of sound, the sampling rate of a compact disc.
Then, he puts on his headphones.
On that particular day he found a hum everywhere in the data. “I thought I was hearing noise,” he recalls.
But it was more than that. The hum had a frequency of 137.5 hertz which would correspond to about 26 days in the original data. That would be the time taken for a particular feature on the sun to swing back around. In other words, he could lock on a feature and listen in.
Alexander realized what he was hearing and messaged a colleague. “The frequency I’m listening to is the rotation speed of the sun. I don’t think anyone’s ever done this.”

Robert Alexander calls his sonification work “exploratory.”
[Image credit: mediaacademica]
It was slow at the research group meeting the next day. After waiting in silence, senior scientist Susan Lepri prodded her troops to action, asking if anyone had news to report. Alexander then explained what he had heard at the coffee shop. He had been listening to the solar wind.
Light from the sun tells us something about the star’s composition, but analyzing solar wind, the stream of charged particles from the sun, might be the closest we come to touching it. “Someone once described it to me with this analogy of a smokestack. We are trying to figure out what’s burning inside the fire by looking at the smoke coming out of the chimney,” says Alexander.
Enrico Landi, a solar physicist colleague of Lepri’s, was present at the meeting. “When I started to understand what Robert was talking about, it seemed to me a way of determining what kind of solar wind you were observing,” Landi says.
There are two types of solar wind: the fast wind, which comes from the coldest parts of the sun, the coronal holes, and the slow wind, which comes from its equator. Ratios of oxygen charged states are used to pick one from the other. As a letter going way back to 1968 suggests, the ratios can also be used to infer the temperature of the coronal holes.
But Alexander’s ear led the researchers to look at charged state ratios of carbon instead, in particular carbon 4 and carbon 6. Sure enough, this ratio provided tighter and more realistic band for the temperature of the source regions, overturning more than a decade of practice.
“I could not believe it at first,” says Landi.
Landi and collaborators wrote up a paper and submitted it last year to The Astrophysical Journal, where it has recently been published.
Landi says the better measurements can provide a test for multiple competing theories in solar science.
Among the mysteries such theories have to explain is why the solar corona, which extends millions of miles into space, is as hot as it is. Landi draws an analogy to a light bulb. The touch of the bulb is hot. As you move away, you expect the temperature to go down. But with the sun, it’s as if “very close to the bulb, the temperature goes up incredibly, and you don’t understand why,” says Landi.
Beyond their own work, Landi and Alexander are intrigued by the possibilities “sonification” of data brings up.
Sonification — the transformation of data into sound — has been used to extract astronomical data by NASA. It has also been used in Europe to study epilepsy and eruptions of volcanoes like Mount Etna. Sounds from the Large Hadron Collider in Geneva were put together at LHCsound, as a public outreach project. Lily Asquith, a young physics researcher, recalls in her blog that the LHCsound project began while she was explaining what goes on at a particle collider to her musician friends.
The researcher who came up with the idea of studying volcanic eruptions through data sonification, Domenico Vicinanza, is also a particle physicist and a composer. To commemorate the 60th anniversary of the bubble chamber, he has composed a piece out of LHC data that will be played by a string quartet — one scientist from each of the particle experiments at Geneva. “We are using it for artistic purposes but the same algorithms can be used by scientists to analyze data,” he says.
In 2010, Stanford University physicist Matt Bellis, who also plays the guitar and trumpet, used data from a particle accelerator experiment called BarBar to program a wind chime for the science hack day at Palo Alto. The idea was to have the particles create sound as they pass through a detector, much like wind creates sound in a wind chime. When he came up with the idea of the wind chime three years ago, his goal was to engage non-scientists in physics, but he thinks that he has learned a little bit more about the data as well.
Manipulating data using computers makes you lose touch with what is actually happening, Bellis says. When you listen to data, it provides a hook to tether you to the real world. “Getting an intuition for the data might help people make new discoveries,” he says.
Alexander believes that it will. While there will always be a need to go back to the data with powerful computer algorithms, sonification provides a novel analytic tool, particularly for periodic astronomical data. Just one NASA satellite sends back 1.6 terabytes of data a day compared with 1.5 terabytes for all of NASA satellites in 2004.
He isn’t putting down his headphones anytime soon.
Filed To
Share
About the Author
Virat Markandeya
Virat Markandeya has a B.A. in political science from Delhi University and a journalism post-grad from the Asian College of Journalism in Chennai. After working in business journalism for four years, he managed to bluff his way into starting up Scientific American’s India content. Two years on, he thinks he has found his calling. He still considers himself an amateur at telling science and wants to be trained at SHERP to become a real pro.