Getting inside your head
How the beauty of brain imaging gives us a peek at what’s really going on in there
Sarah Jacoby • December 14, 2012
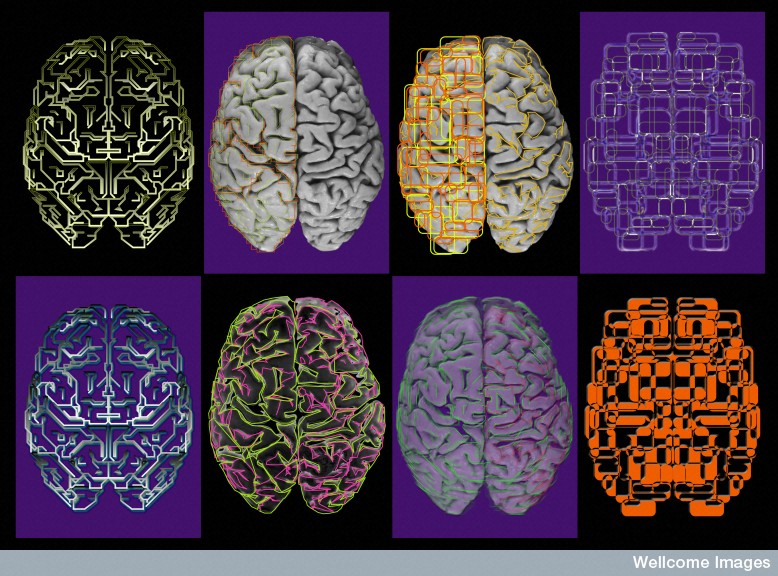
Composite artwork showing 8 different representations of the dorsal surface of the brain. [Image credit: Heidi Cartwright, Wellcome Images]
You’ve seen them – those brilliant rainbow swirls – and you’ve been told you’re looking at an image of the inside of a living human brain. But how brain researchers get those pretty pictures, and what they’re really looking at, isn’t always so obvious.
Because they have to rely on indirect measures of brain activity, researchers have gotten creative about using whatever information they can get to make those images without prying open your skull. Here are some of the most common imaging methods, and how they give us a window to your buzzing neurons:

fMRI images from an emotion language-based psychology task. [Image credit: Ovaysikia et al. 2010 via Wikimedia Commons]
The use of fMRI (functional magnetic resonance imaging) has skyrocketed in the past decade. Some researchers have used fMRI scans to argue that we know the broad neural basis of everything from love to lying. But is that really what the images are showing us? Ed Vessel, a neuroscientist at New York University, uses fMRI to study our perceptions of different forms of art.
Vessel explains that fMRI capitalizes on the magnetic properties of our oxygen-rich blood. When our neurons are firing, they need energy. Getting them that energy requires a series of reactions that bring more oxygenated blood and usable energy, in the form of glucose, into brain tissue. Researchers can then compare the levels of oxygenated blood to deoxygenated blood by taking advantage of the differences in their magnetic properties. By looking at where there’s oxygenated blood, scientists can infer where the energy-hungry neurons are active.
With fMRI readings Vessel has been able to show that while our objective judgments of art (e.g. whether or not it has good composition) activate one brain region, our gut-reactions activate a completely different part of the brain, including areas usually associated with emotion. But Vessel cautioned that fMRI requires a great deal of replication to be reliable, and should usually just be taken as a first step to narrow the search for the neural basis of a behavior.

PET images showing brain areas active in different types of addiction. [Image credit: Nora Volkow 2001 via Wikimedia Commons]
That’s where PET (positron emission tomography) comes in. If brain researchers use fMRI to get an idea of which part of the brain to look at, they’ll use a PET scan to dig even deeper and find out which neurotransmitters (the chemical messengers in the brain) are active there. The PET scan uses a radioactive tracer (most commonly fluorodeoxyglucose) that acts like glucose in the brain.
To get scanned, a patient is first injected with a tracer and then placed in the scanner. After 30 to 60 minutes, once it has made its way to the brain, the tracer will undergo radioactive decay by releasing positively charged positrons, a type of subatomic particle. These particles immediately collide with the surrounding negatively charged electrons in the brain, and annihilate with each other to create two photons. And it’s these photons that the PET scanner can identify. A higher amount of these photons is a sign of more neural activity because more metabolic activity is going on.
The information we get from PET scans has been incredibly helpful for discoveries such as nailing down dopamine’s critical role in addiction as well as early diagnosis of degenerative brain disorders like Alzheimer’s. Although PET technology has been around for decades, we’re only now able to create tracer chemicals tailored to study specific neurotransmitters (like dopamine) or specific receptors for those neurotransmitters, says Vessel.
But what if we want to look beyond individual brain areas to see how those areas are connected? Is there a way to do that with more detail than fMRI, but less radiation than PET?
The answer is yes. Techniques like DTI (diffusion tensor imaging) measure how quickly water flows in the brain from one location to another. If it moves quickly, odds are good that the two areas are physically connected. To measure water flow, DTI uses the same magnetic analysis techniques that fMRI is based on, but takes two measurements, one after the other. In the first measurement researchers tag magnetic dipoles in our blood, and in the second measurement they track how far and how quickly those pairs have moved. “It’s like measuring how quickly water moves in a hose versus a balloon,” says Vessel.
Water inside the brain will move faster along brain cells that are connected and form the neural fiber roadways that carry chemical and electrical messages between parts of the brain. And that’s exactly what brain researchers like Eric Sigmund and Mariana Lazar are finding. Both are working on projects at New York University using DTI. “We see diffusion that’s faster along the fiber than across it,” said Sigmund, which allows him to reconstruct a picture of where those fibers are and in what direction they send information. By using DTI Sigmund and Lazar can track the abnormalities in brain cell connections that we see in diseases and disorders like Alzheimer’s and autism.

Image of neural fibers reconstructed using DTI readings. [Image credit: Thomas Schultz 2006 via Wikimedia Commons]
While all these techniques provide different information, they’re all attempts to answer the same basic question: What’s really going on in there? Because they try to answer that question in different ways, they’ve become complementary techniques, says Vessel. And any way you look at it, those pictures are pretty sweet.
Filed To
Share
About the Author
Sarah Jacoby
Sarah Jacoby recently graduated from Reed College where she studied behavioral neuroscience. She loves Alan Partridge, the Eels, and the limbic system. You can follow her on twitter (@sarah_jacoby) and tumblr (sarah-tonin.tumblr.com).