The climate mathematician
As the world warms, scientist David Holland is building a weather forecast for the polar ice caps
Gayoung Lee • June 25, 2024
For climate scientist David Holland, the world can be organized into a set of equations [Credit: Courtesy of David and Denise Holland]
The first time self-proclaimed climate mathematician David Holland used the power of numbers to prove how a glacier melts, it nearly killed him.
Back in 2007, a colleague noticed that Holland had explained the immensely complex motion of huge ice chunks falling off Greenland’s Jakobshavn glacier using nothing but numbers and mathematical expressions. Impressed, he told Holland he should go see the glacier for himself.
At the time, Holland’s “field experience” mostly consisted of walking to his New York University lab and turning on the computer to work on one of his mathematical simulations. But now that satellite data had confirmed the accuracy of his Jakobshavn simulation, he was eager to see the real thing — until he remembered that no one in the travel group, including his wife, Denise, had any idea how to navigate treacherous glacial terrain.
That’s when he started thinking about the possibility of a premature demise. “And in the darkness of winter [in] Greenland, with dog sleds running around on a glacier with crevices? We said, ‘yeah, that’s where we’re gonna die,’” Holland recalled with a chuckle.
Fortunately, everyone made it back alive. The adventure became the first of dozens Holland would undertake with his team, the Environmental Fluid Dynamics Lab. Their ongoing quest is to create a glacier forecasting service using mathematical models. Just as a weather forecast uses equations to predict changes in the sky, a glacier forecast could play a part in the creation of a larger climate forecast. This will help scientists and policymakers understand how, when and where a warming climate will transform the 10% of the Earth’s surface sheathed in ice.
The work is important because the potential consequences are terrifying. “If you take all of Antarctica that’s unstable — say, about 10 meters of ice — and you lose it,” then sea level might go up by 10 meters, or 30 feet, everywhere in the world, Holland said. “Florida’s gone, Shanghai is gone, countries are gone,” and no protective walls can be built fast enough to shield these areas from submersion.
“So that’s when you want to get the equations right, because we look in the past and look at sea level,” he went on, drawing a jagged line across a chart displaying changes in global sea level, “it goes up and down and back again. But then suddenly it shoots up.”
When that happens, he said while pointing straight up, you can count on finding some record of huge ice chunks that fell into the sea around that time. This is why a glacier forecast is vital to the development of a reliable sea level forecast. What Holland hopes to create is a solid, data-backed system that can reliably predict how and when glaciers break off in large pieces.
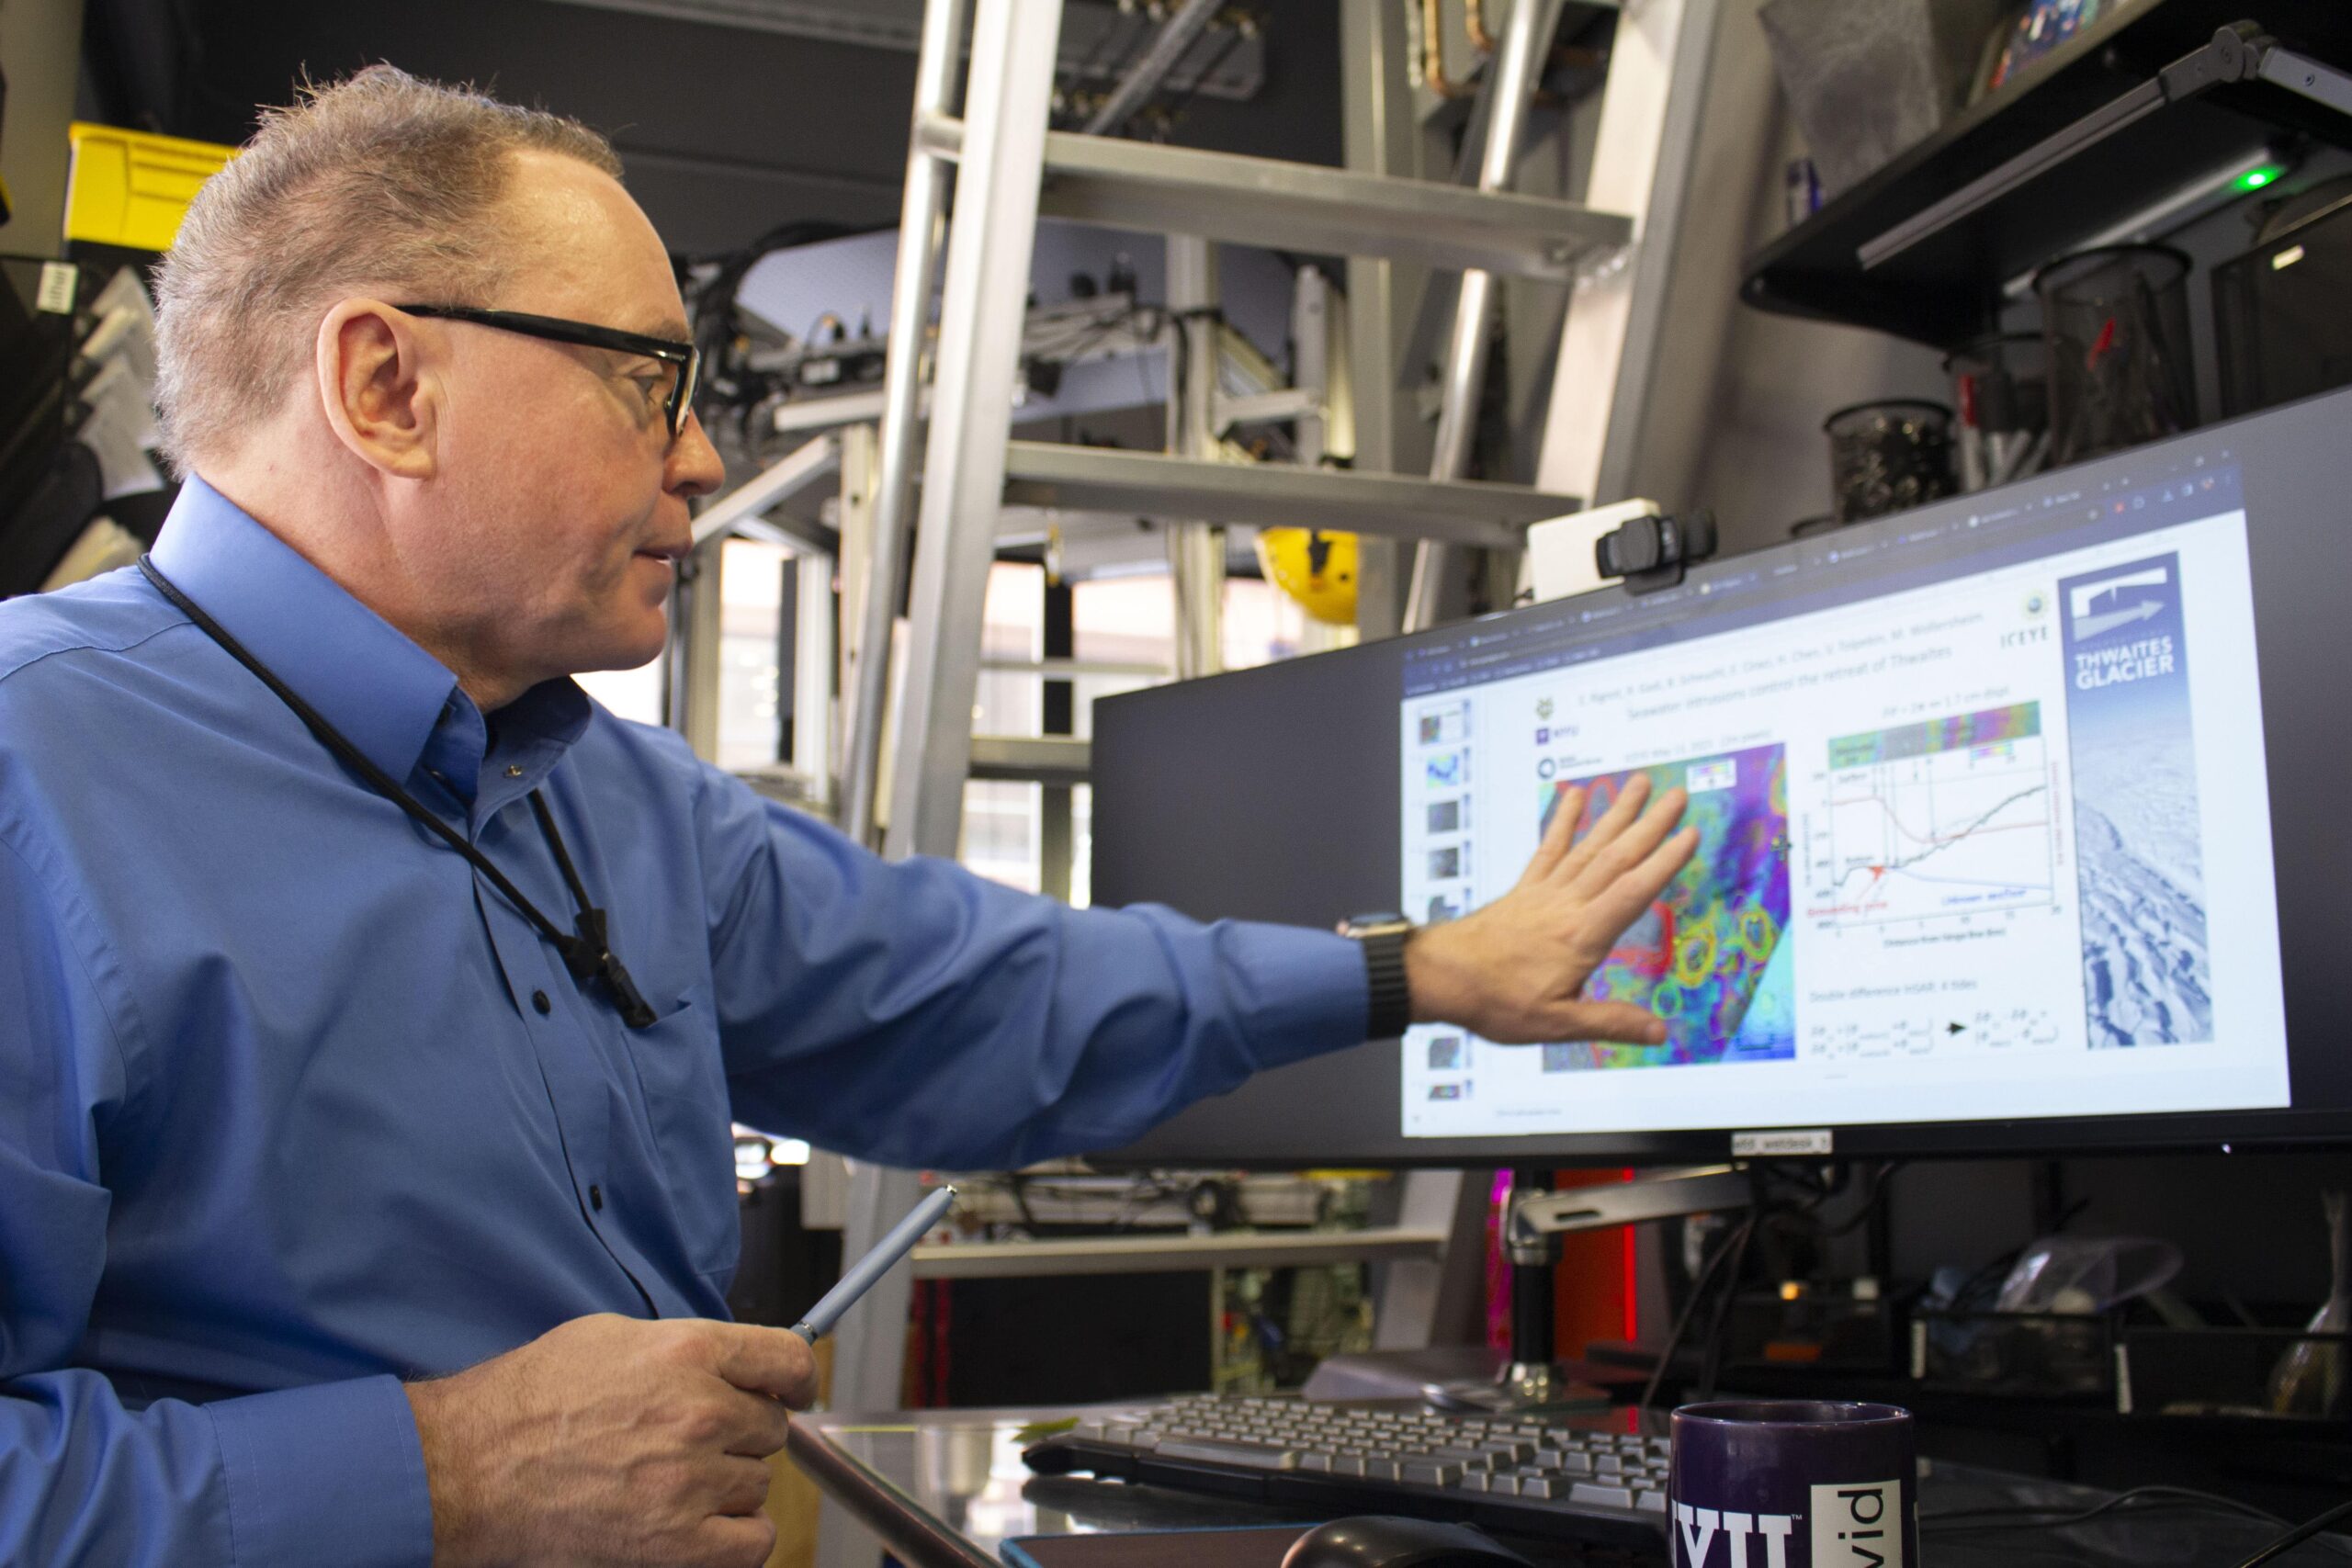
Holland and his colleagues are devising a mathematical model of the physical motion by which glaciers lose ice and contribute to sea level rise. [Credit: Gayoung Lee]
Strong models help reduce uncertainties in how scientists communicate their findings, explained glaciologist Keith Nicholls, who works with Holland on a project tracking Antarctica’s Thwaites Glacier. When glacial melting — a key contributor to global sea level rise — disrupts the lives of coastal communities, the stakes are too high for the answer to be a “maybe.”
“If you tell the government that [sea level] will go up, maybe anywhere between 20 centimeters to one meter — nothing,” said Nicholls, who works at the British Antarctic Survey. “But if you nail down ‘one meter,’ then they really have to start thinking and planning for it.” But these mathematical equations don’t spontaneously occur from just sitting down and thinking about how it might be done. Instead, Holland said, “it’s coming from observing nature. You observe what nature does, and then you can mimic it in an equation.”
Holland believes in showing people how math works. The simpler, the better. Even something as dramatic as sizable portions of glaciers disappearing, he said, can be captured in two simple, somewhat intuitive elements: ice that melts and ice that breaks. From the sum of these two elements, it’s possible to predict specific conditions under which glaciers will lose ice. In our oceans, all of this additional water, in addition to rising sea level, also dilutes the salt content of seawater near the poles, disrupting normal circulation and altering weather patterns.
Walking across the room to a whiteboard, he writes out a large equal sign, with some letters like “I” for “ice today.” Other symbols denote melting factors like the amount of sunlight on a given day, the friction experienced by ice when it moves or the heat capacity of the ocean.
That’s the melting equation, which Holland developed with glaciologist Adrian Jenkins back in 1999. Since then, the influential equation has been fortified by data collected from different research teams, including Holland’s, and now acts as an integral component of different climate models.
“Models encapsulate our physical understanding of the system,” Jenkins explained. These then effectively act as virtual versions of the ocean or ice sheets that can not only be used for climate research, but can also equip the public with a tangible picture of how sea level rise affects our lives.
Holland and Jenkins have since gone in different research directions, but Holland still hunts for the second part of that 1999 discovery: the ice-breaking part, or the calving equation. Stepping back from the whiteboard, Holland then draws a large, blank square next to the melting equation.
“So the ice is changing, we can see that from the camera photos from yesterday and today. The melting equation can account for some of that, but the rest is because it broke off, it’s gone. I don’t know what to put here,” Holland said, waving his hands at the empty box scribbled next to the melting equation. “Where did it go? Where [are] all the formulas in here?”
His colleagues have heard this before. “He has this almost spiritual commitment to learning and discovery,” said Peter Terazakis, a climate artist and professor at NYU. Terazakis, who has been a part of Holland’s Greenland outings for around a decade, explained that for Holland, these rhetorical questions seldom demand actual answers. Rather, they’re more representative of the way in which Holland regards his research: as a teaching demonstration.
That’s also reflected in the way in which the lab’s expeditions have prioritized education. Aside from data collection for his own research, Holland takes along students, journalists and even politicians to see and experience the changing climate for themselves.
In fact, the lab itself started with the purpose of helping students understand how equations of the weather and climate function in the real world, according to Denise Holland, his wife and the primary logistics officer at the lab.
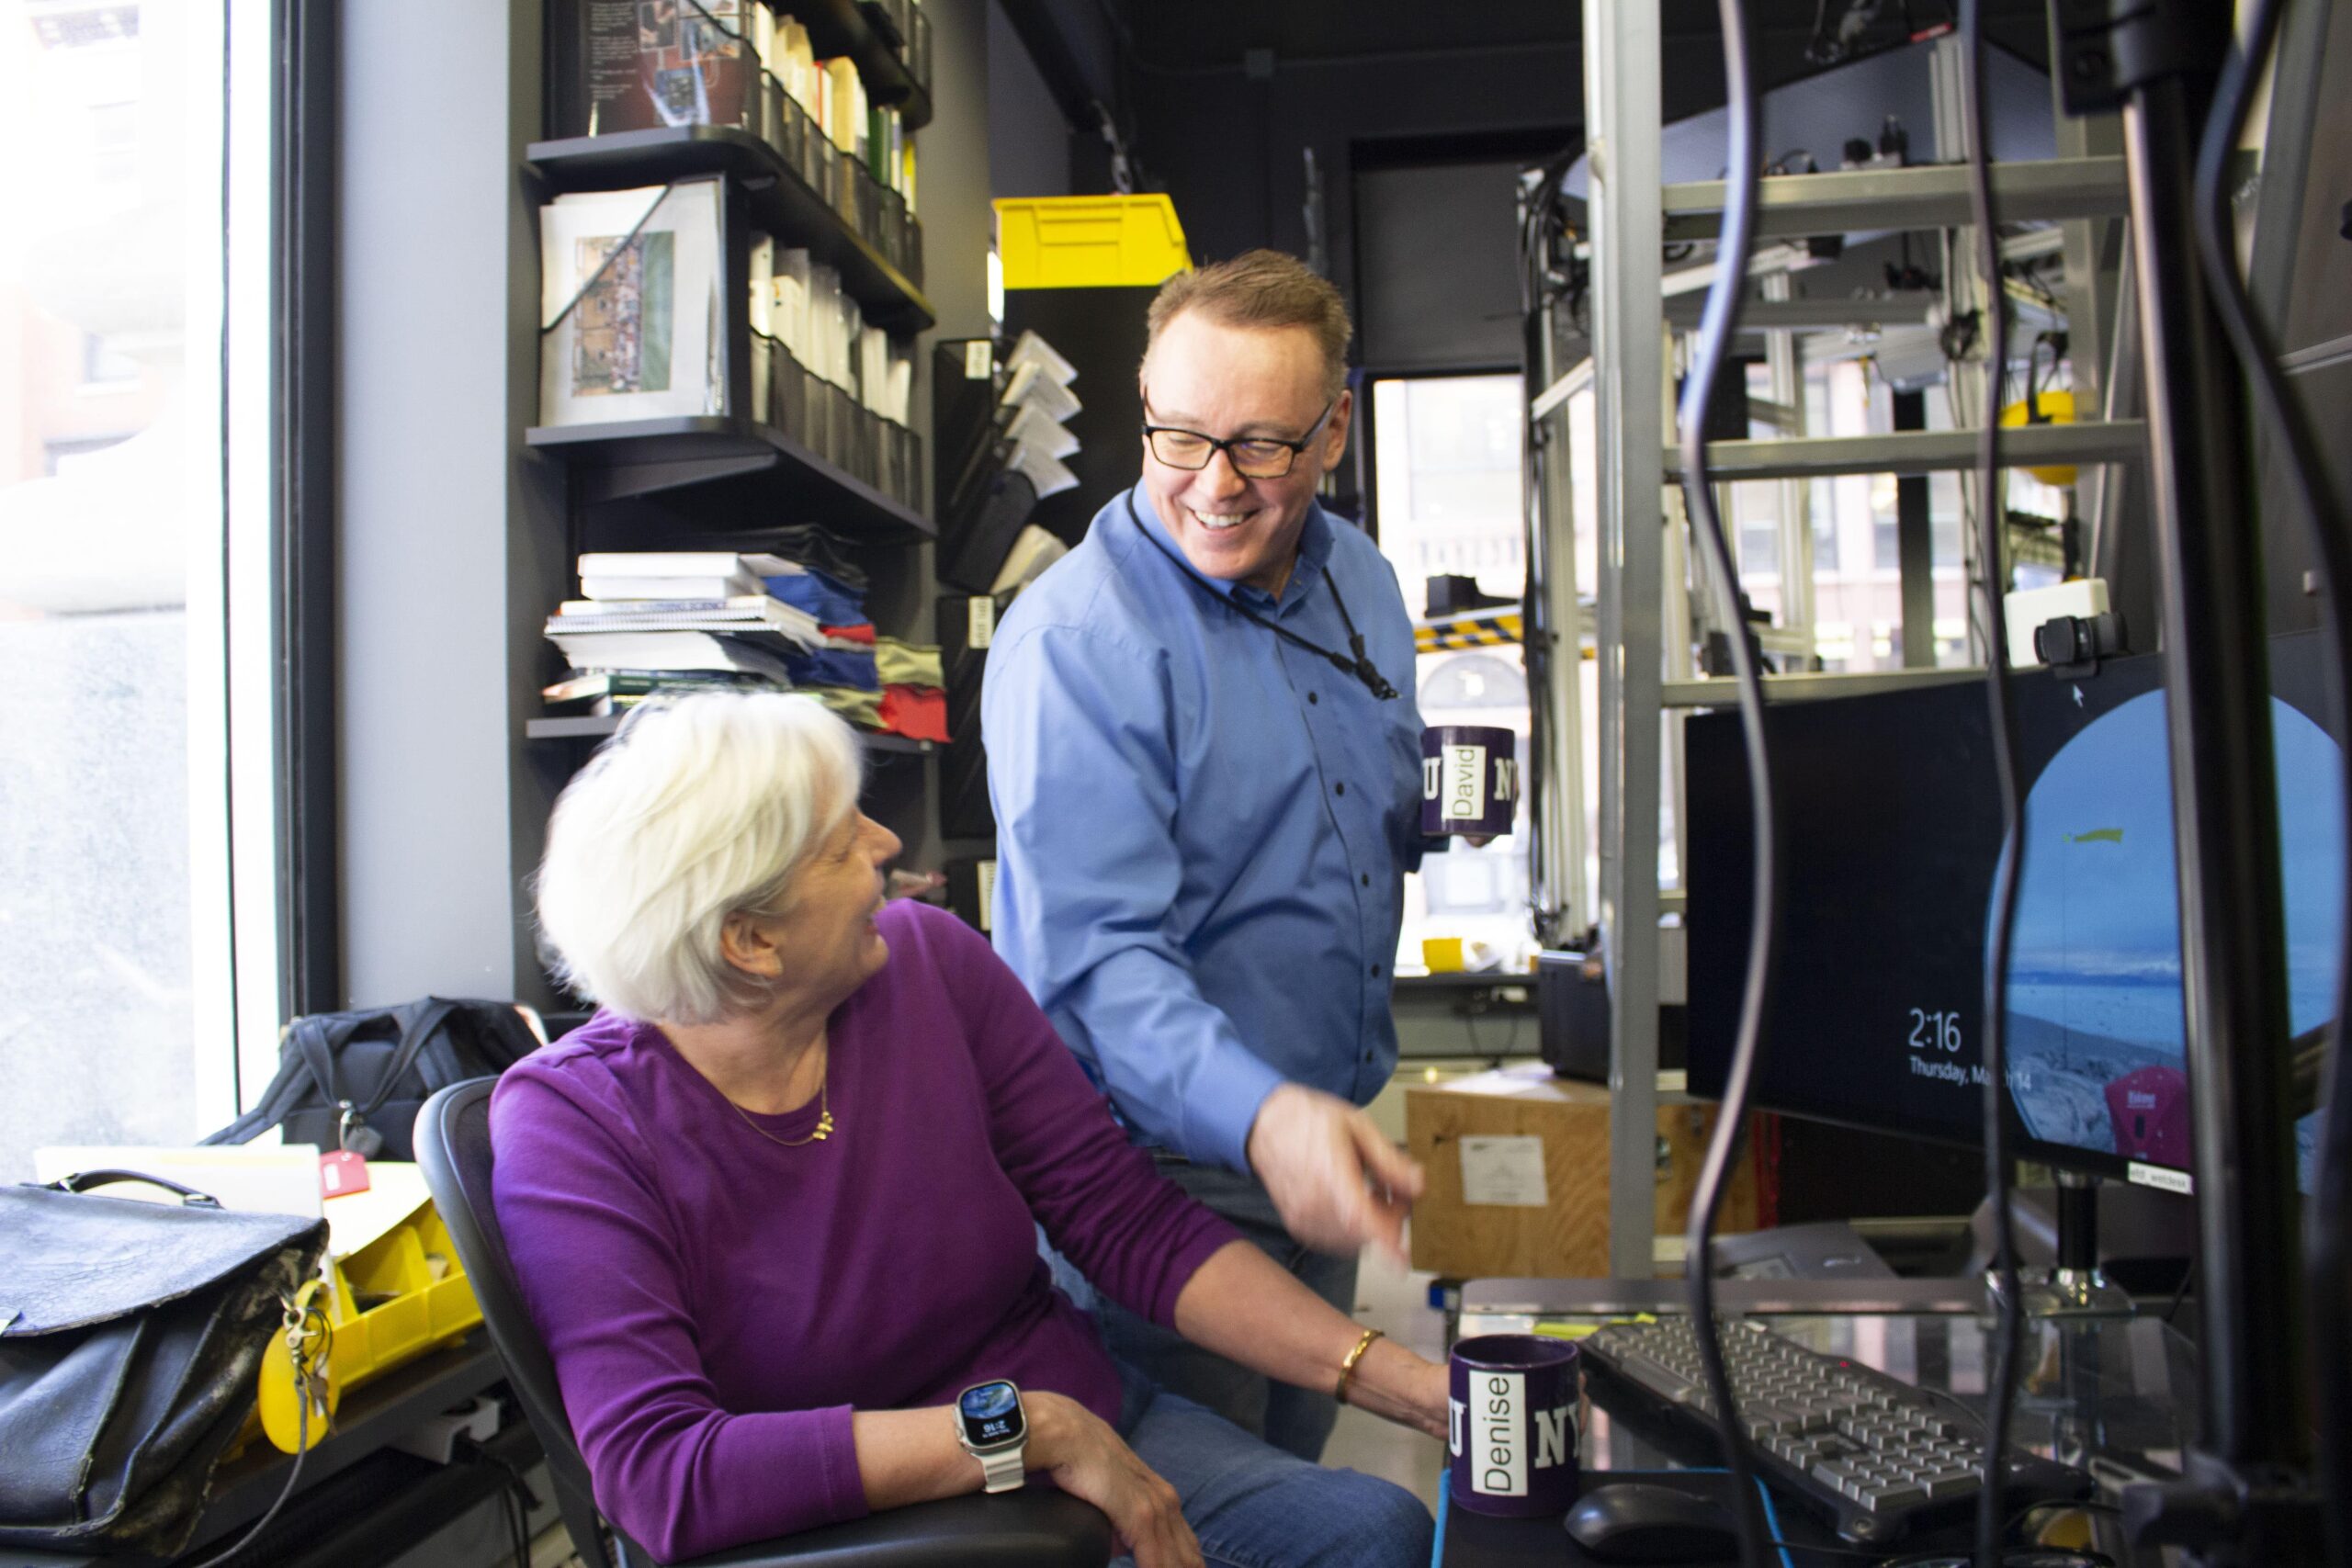
Holland’s wife Denise is the lab’s logistics officer. [Credit: Gayoung Lee]
“So it was just something that evolved quite naturally,” she explained. The polar regions are desolate and unwelcoming, she said, and it takes a lot of effort to plan just one outing to Greenland, never mind over 30 within the last 17 years. Adding to the drudgery is the sluggish pace at which the research progresses, and the real risks of probing around under such dangerous conditions.
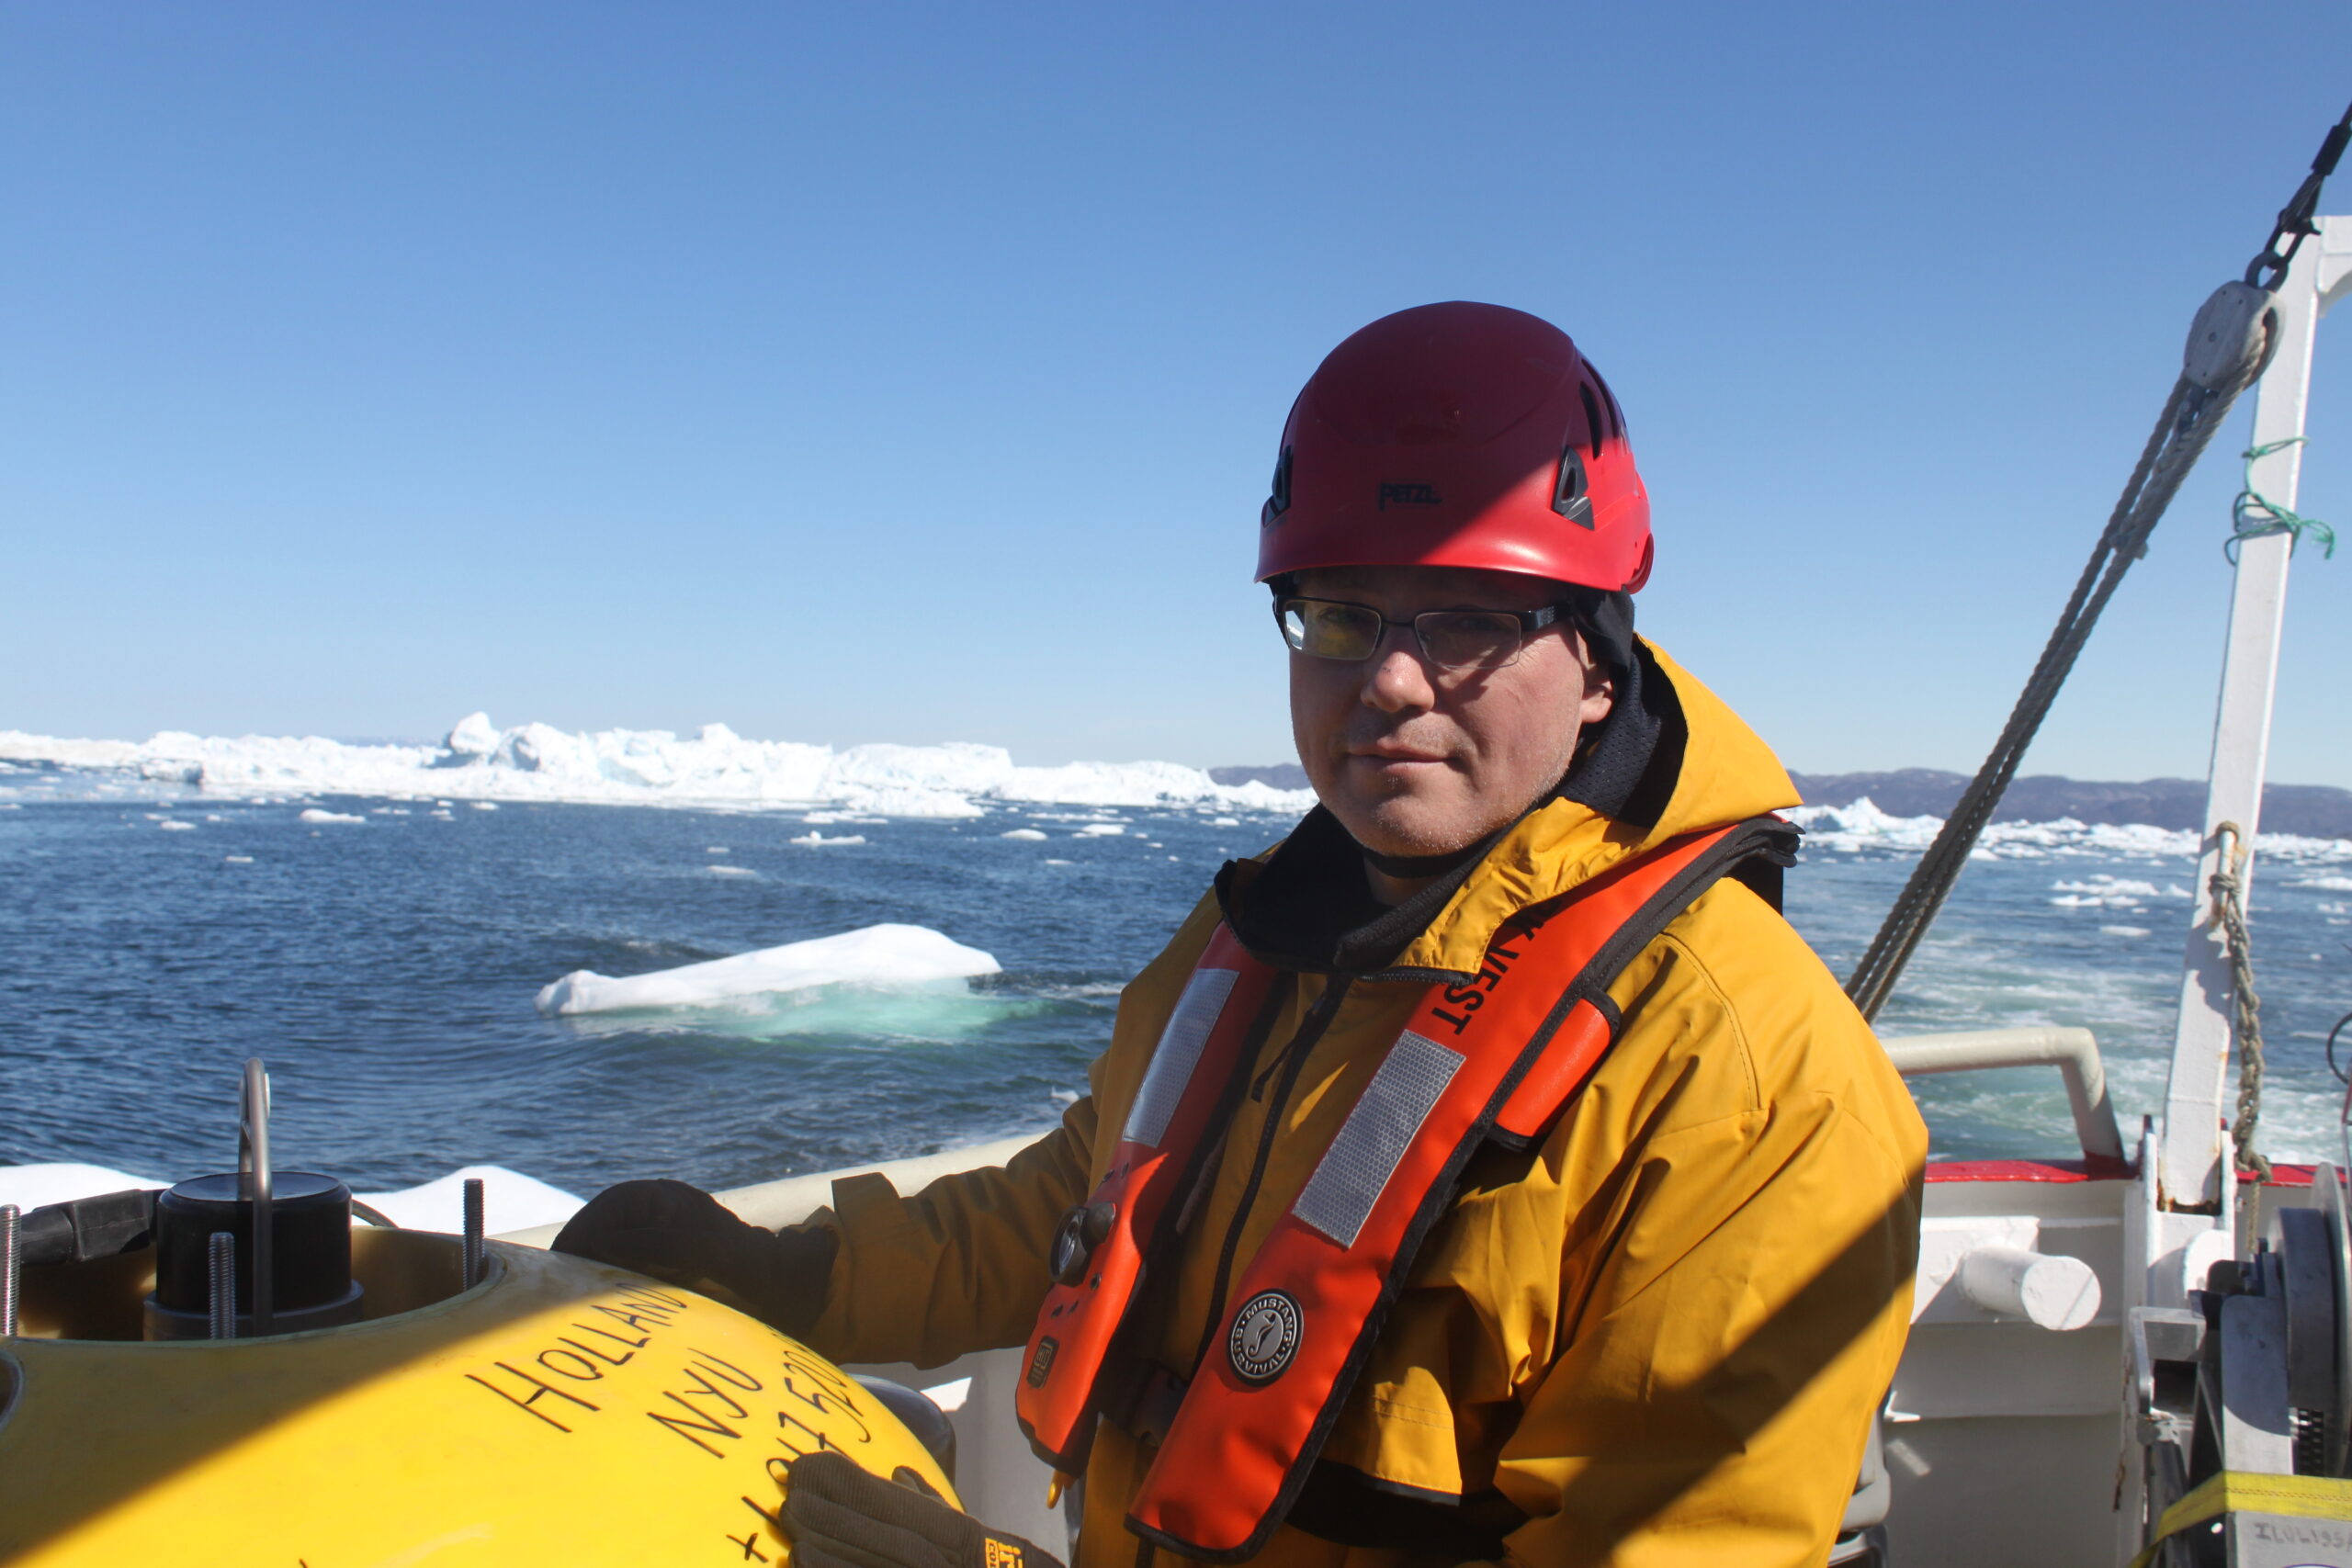
Over the course of his Greenland expeditions, Holland has pioneered a variety of unusual ways to capture information from nature, which, according to Nicholls, have introduced viable methods for obtaining useful climate data to the field.
For example, boreal species of cod on the west coast of Greenland had been tagged for conservation purposes, but those tags also collected temperature data, Nicholls explained. So Holland used the temperatures in this long-running data set to prove the area had warmed substantially as the Jakobshavn glacier retreated.
While Holland’s team has connected a tremendous amount of glacier data over the past seventeen years, it’s still not enough to develop a sufficiently precise mathematical model. The team is making plans to go to Greenland again this summer. Everything helps, Holland added. “The only way out of the woods is through bits, and then you [can] say this is something you understand about your planet.”
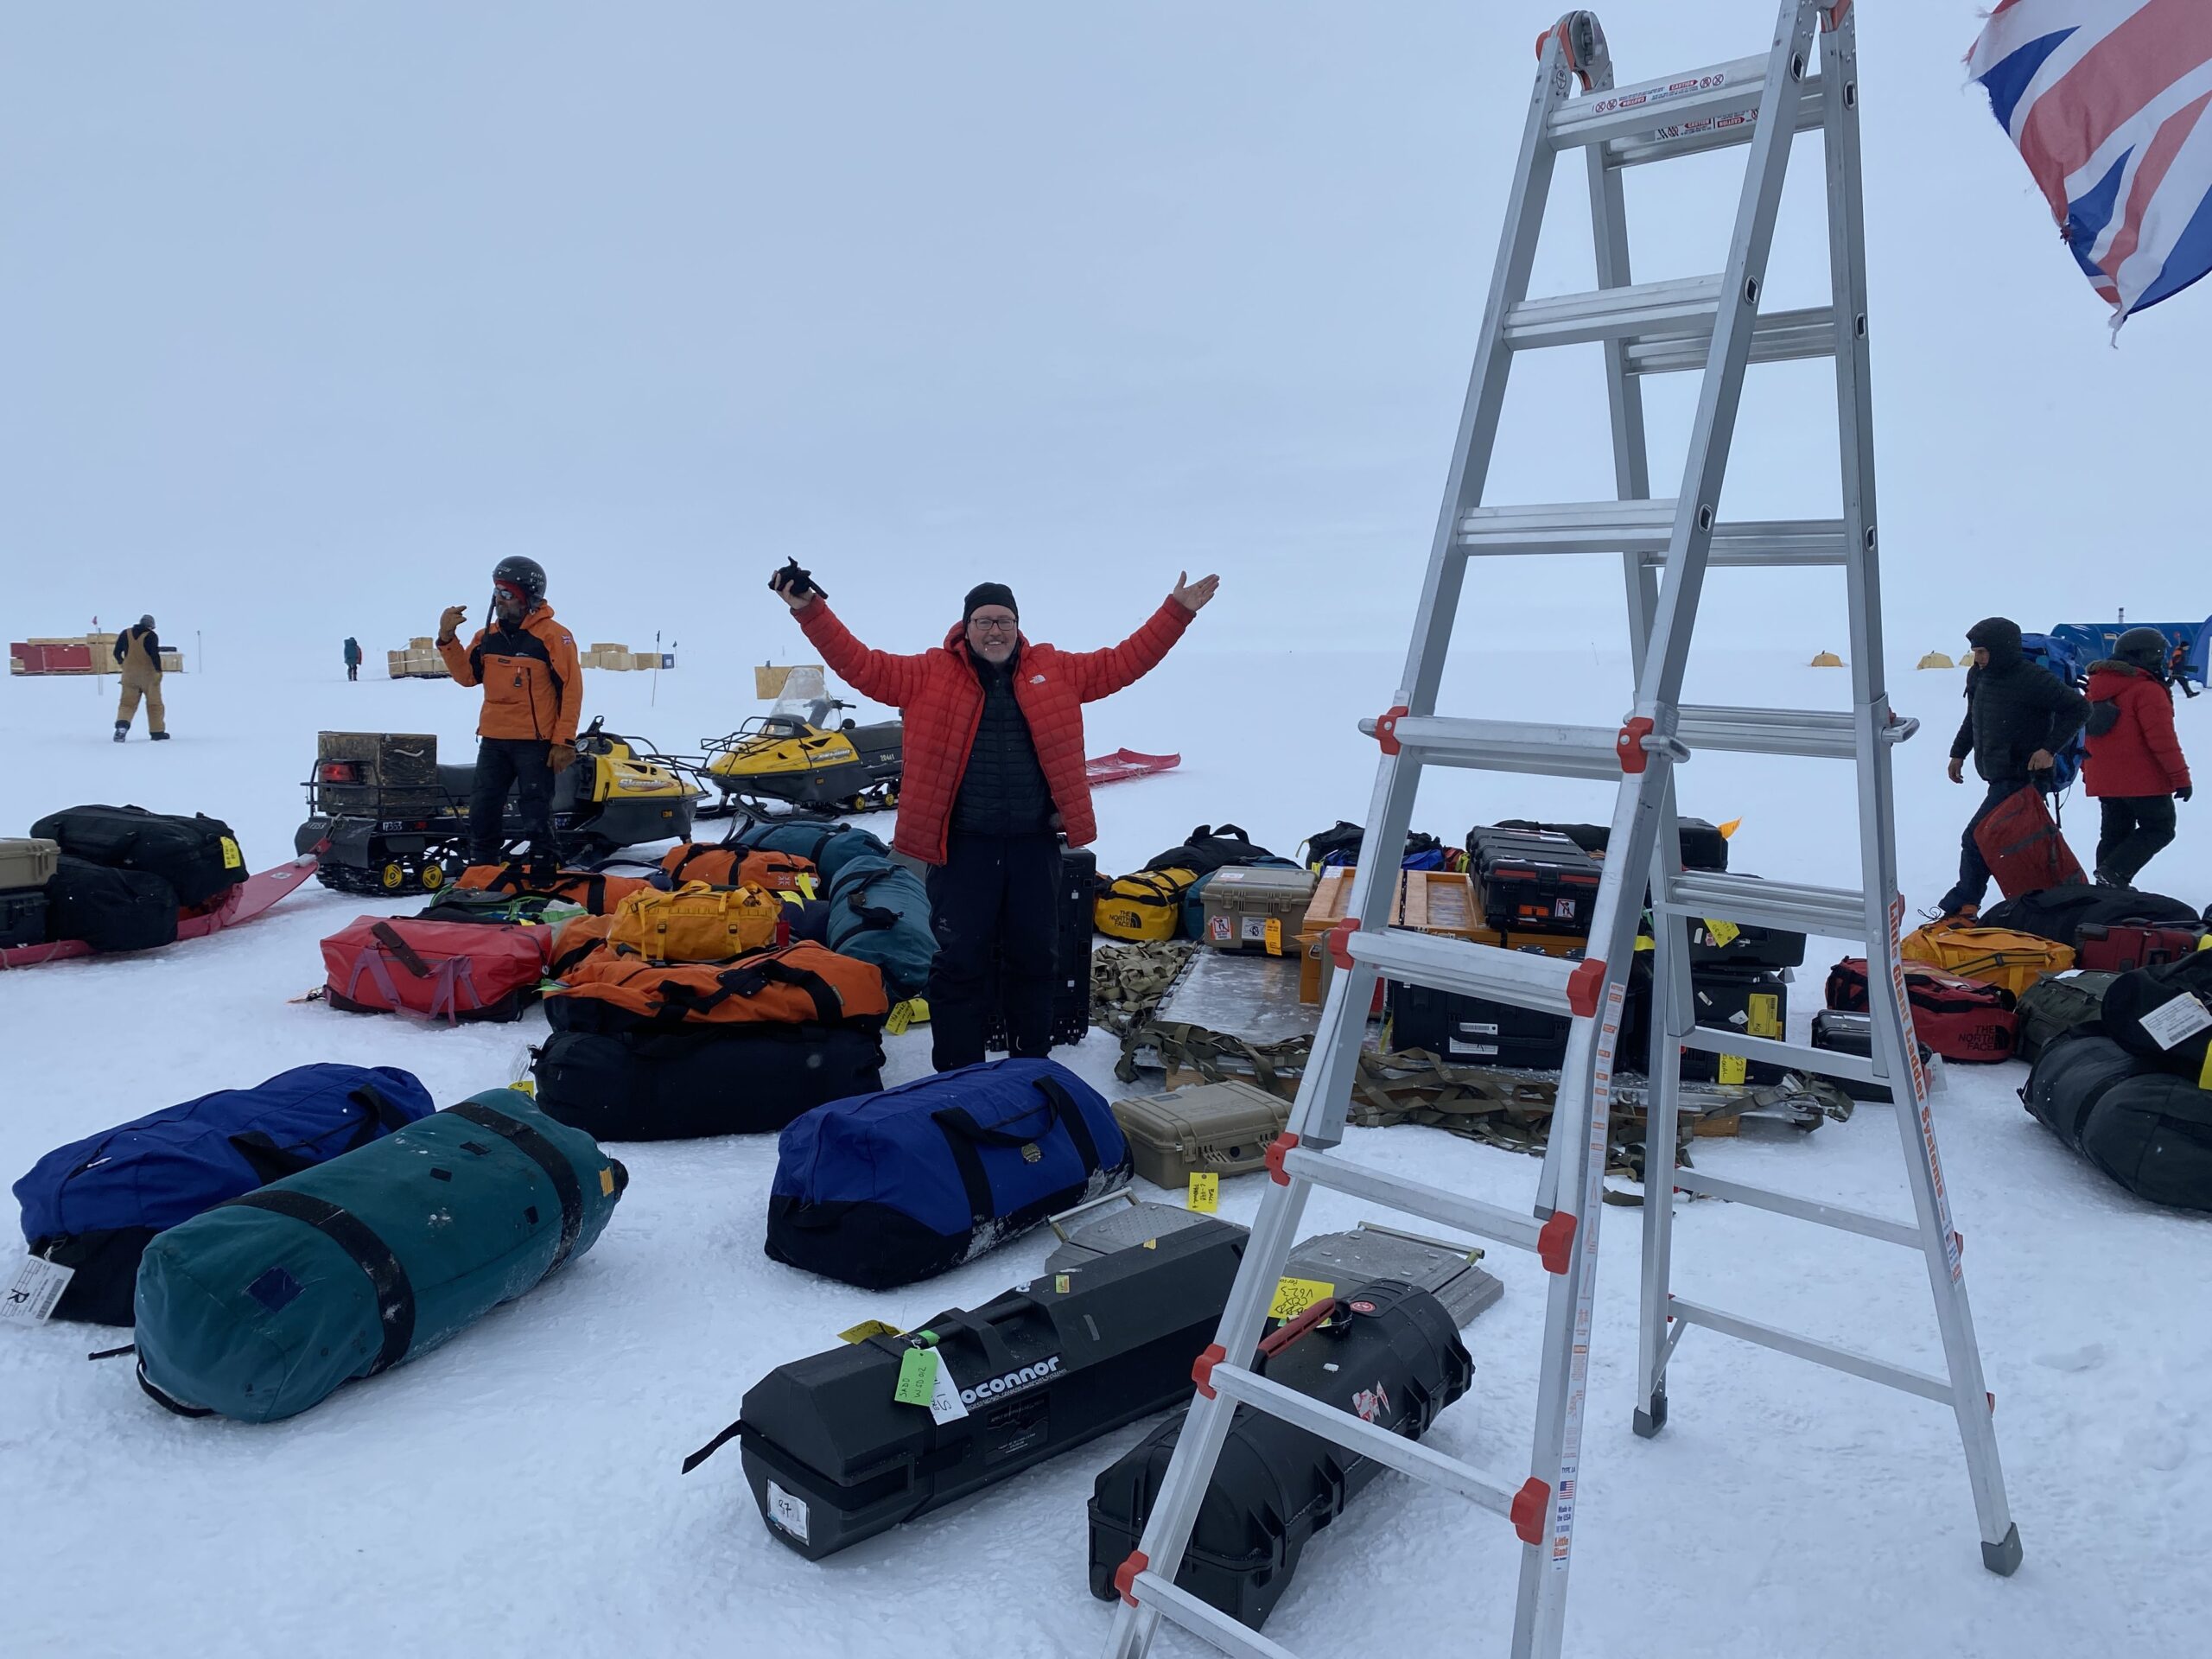
This summer, Holland plans to visit Antarctica and Greenland to test out a new data collecting method for devising a calving equation [Credit: Courtesy of David and Denise Holland]
In that sense, the glacier forecasting system is a backdrop, Holland said, to a much bigger, longer-term mission.
“I always hear people saying we need to be better stewards of the planet. And that’s just garbage. We are not stewards. We are passengers. And we should behave.”
Filed To
Share
About the Author
Gayoung Lee
Gayoung Lee is a science writer and illustrator from South Korea. A philosopher by training, her interests lie in uncovering and writing about the unexpected connections between the world and various scientific phenomena, particularly in theoretical physics and chemistry. Her latest hyperfixation concerns the mathematical roundness of the game character Kirby.