Mapping the shake, rattle and slip of tectonic plates
Seismologists can track earthquakes faster, and in more detail, than ever before
Amy Nordrum • December 23, 2013
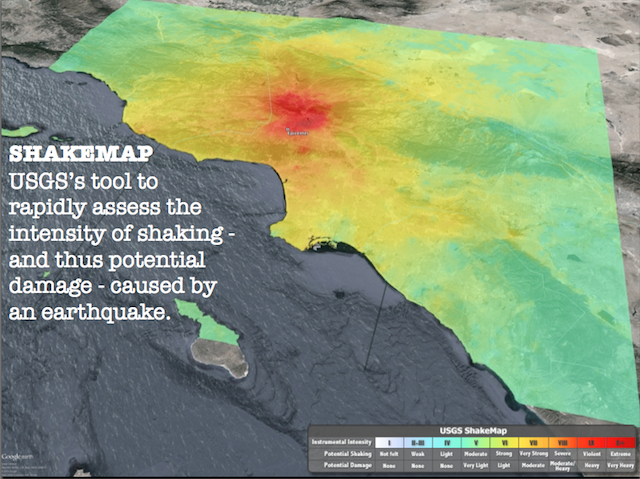
Digital tools like this map help earthquake researchers quicken response to major disasters [Image credit: Gavin Hayes, USGS]
These days, earthquakes look a lot different to Gavin Hayes. Instead of black-and-white seismographic spikes, Hayes and his fellow seismologists at the United States Geological Survey National Earthquake Information Center plot aftershocks as colorful pinpoints on the 3-D gridlines of a computer screen. Using digital maps and models allows them to better study the subsurface mechanisms that cause an earthquake and inform response teams of its severity faster than ever before.
“The [National Earthquake Information Center] has had to change how it communicates earthquakes,” Hayes said to seismologists and citizen scientists during a talk in September at the American Museum of Natural History in New York City. The federal government requires the information center in Golden, Colo., to publicly report earthquakes above magnitude 2 to 3 — those that people can feel — in the U.S., as well as slightly stronger shakes felt around the world. Ten years ago, the information center used to only publish magnitude, location and an analysis of how the fault, or break in the earth’s crust, had shifted in each quake. Now, the researchers roll out a full “suite of products” including maps and models of what happened beneath the surface. The newest tools help answer critical questions such as: Where is the most damage? Where are the most deaths? Will international aid be needed?
When an earthquake occurs, a modeling software called ShakeMaps uses factors such as distance to the epicenter and depth, recorded on seismometers, to plot shaken areas on a scale from green to orange to red. The closer to red, the worse the shaking, which typically means greater damage.
Then, the PAGER system (Prompt Assessment of Global Earthquakes for Response) matches the ShakeMap against population density to find severely shaken areas with a lot of people. Those are the areas where injuries and fatalities most likely occurred. PAGER also assigns a color to the quake based on whether it might require a regional, national or international response.
Hayes said his colleagues can turn this information around faster than ever before, which could mean shorter response times by governments, emergency personnel and aid agencies. It took nearly an hour and a half for the National Earthquake Information Center to announce the magnitude of an earthquake that rocked Sumatra, Indonesia, in 2004. Seven years later, it announced the magnitude in just 20 minutes for a temblor in Tohoku, Japan. Other information that once took a day or more to release — such as damage estimates and a model showing the slip along a fault line — is now published within the hour.
Seismologists know that the faster they hear about a quake, the faster they can publish the details. So they scan for earthquake-related tweets, which can point them to a new event even faster than seismometers in some cases. Hayes’ team also asks users to report earthquakes using a questionnaire on the information center’s website called “Did You Feel It?” For one earthquake in Virginia, 148,000 people from Florida to Canada logged in to report that they had.
Scientists at the information center are also using digital tools to aid in earthquake preparedness. Before an earthquake strikes, they can create rupture models to simulate shaking and identify potential hazards, like buildings which might not hold up to a hard shake, using “what if?” scenarios based on hypothetical earthquakes that could someday hit a region. This holds practical potential, said Brian Tucker, a seismologist and president of GeoHazards International, a non-governmental organization that helps communities prepare for earthquakes. Tucker has used these models to point out the need for reinforced infrastructure in Haiti, India and Bhutan in Asia. “This has been very helpful in raising awareness of the current risk,” Tucker said, “and in prioritizing what buildings and areas of the city should receive attention.”
In the future, these models could also prove useful following an earthquake, said Ricardo Taborda, civil engineer at the Center for Earthquake Research and Information at University of Memphis. Taborda produces hypothetical large-scale earthquake models like those at the National Earthquake Information Center. “We hope that in the future, an earthquake happens and within 24 hours we produce an approximate simulation of what occurred so we can distribute resources,” Taborda said. As the technology advances, the window of time between an earthquake and its simulation will get smaller and smaller. “We hope that we will be able to really have a rapid response based on this kind of modeling.”
The benefits of this work could someday be measured in lives, as scientists expect earthquakes of the coming decades to set new records for deaths and economic loss. Exploding populations in developing countries are cramming into fast-growing and densely packed cities, which do not always enforce modern building codes and carry greater risks than those in developed nations. “Mother Nature is very clever about targeting these populations in the worst conditions,” Taborda said.
That’s precisely why researchers at the National Earthquake Information Center are so intent on using information technologies to mitigate the impact of major earthquakes. If tracking tweets and tweaking software can slow or reverse the expected rise in fatalities from earthquakes around the world, and especially in developing countries, then seismologists will have found a way to use the technology of the 21st century to temper, at least in part, its growing risks.
What should you do in an earthquake? The National Earthquake Information Center recommends you “drop, cover and hold on” if you’re caught in an earthquake. In the United States, you’re much more likely to be injured by a falling object than a collapsed building. Drop to the ground, crawl under a heavy object like a table or bed and ride out the shaking. Read more safety tips for what to do if a quake strikes while you’re in bed, in a grocery store or driving down the road.
Filed To
Share
About the Author
Amy Nordrum
Amy Nordrum is a science writer who has published in Scientific American, Popular Mechanics, The Atlantic, InsideClimate News, Psychology Today, Men’s Journal, and American Cowboy. She was previously based in Alaska and holds a bachelor’s degree in journalism from Ohio University. Amy is currently completing here fifth NYC-based media internship with Scientific American.
2 Comments
Using digital maps and 4D GeoSEIS Tomography models allows them to better study the 4D-subsurface mechanisms that cause an earthquake and inform response teams of its severity faster than ever before.
*We have used multispectral images of WorldView-2 for volumetric modeling of the 4D-earthquake mechanisms with much higher resolution than magneto-telluric data.
*We have used geophysical data & multispectral images of Landsat 5-7, ASTER, Hyperion satellites for volumetric mapping of geological formation & tectonic structures up to depth 19-60km: http://www.flickr.com/photos/jeisus2012/5559736588/in/set-72157626153283579.
Validation certificate for “4D GeoSEIS Tomography” Method: http://www.slideshare.net/JarosloveBondarenko/4-d-geoseissertificatrev1.
This research is a complement advance method for configuring the
exactness of the place which the earthquake has happend and its effects
to the adjacent areas but does not solve the main problem.The main point is
to forecast the event(earthquake)before its occurrence like weather fore-
-casting.Then the life would be better.